Plot presence/absence of taxa by each cluster in phylota object.
See also
Other tools-public:
calc_mad(),
calc_wrdfrq(),
drop_by_rank(),
drop_clstrs(),
drop_sqs(),
get_clstr_slot(),
get_nsqs(),
get_ntaxa(),
get_sq_slot(),
get_stage_times(),
get_tx_slot(),
get_txids(),
is_txid_in_clstr(),
is_txid_in_sq(),
list_clstrrec_slots(),
list_ncbi_ranks(),
list_seqrec_slots(),
list_taxrec_slots(),
plot_phylota_treemap(),
read_phylota(),
write_sqs()
Examples
library(phylotaR)
data(cycads)
# drop all but first ten
cycads <- drop_clstrs(cycads, cycads@cids[1:10])
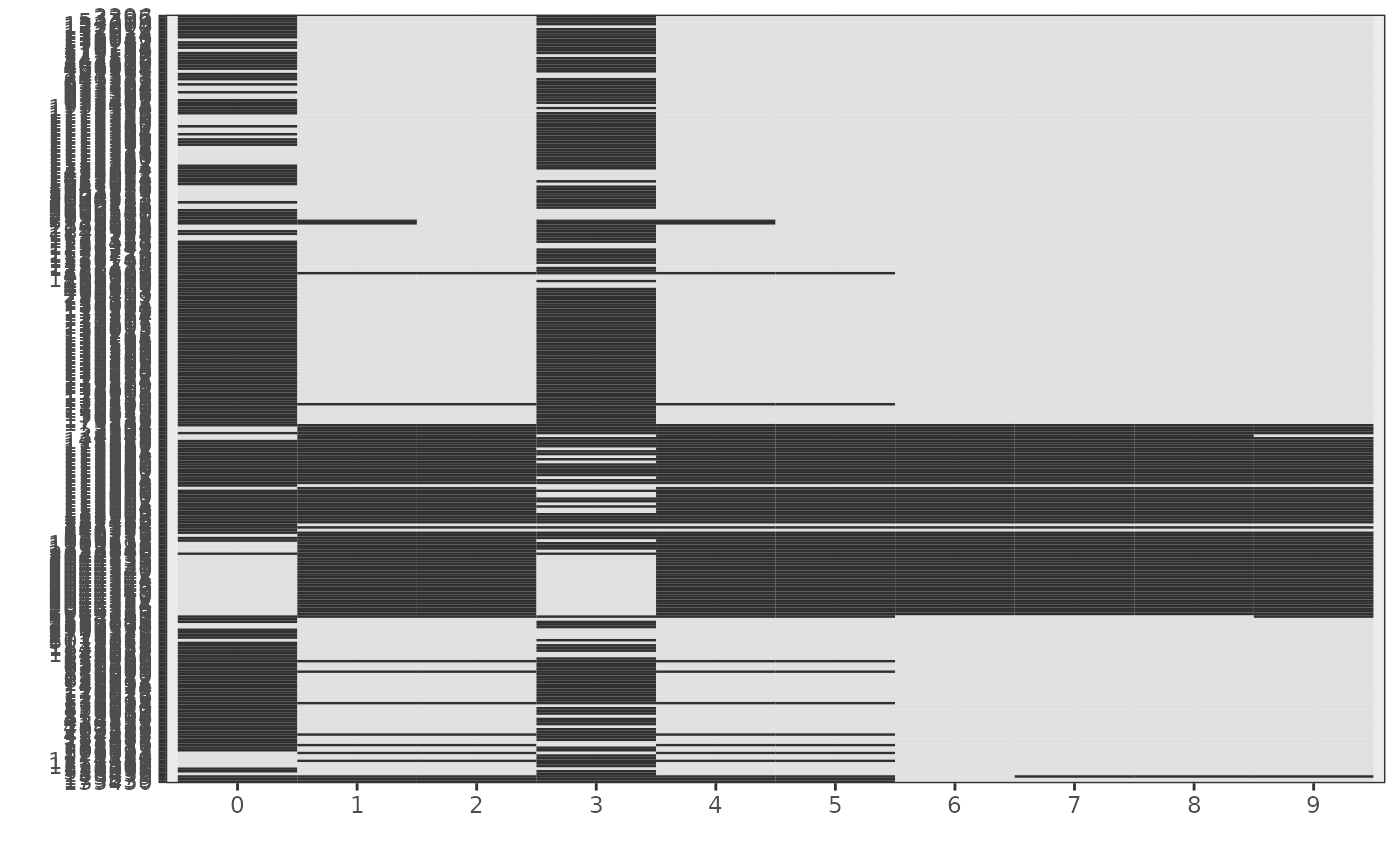
# plot all
p <- plot_phylota_pa(phylota = cycads, cids = cycads@cids, txids = cycads@txids)
print(p) # lots of information, difficult to interpret
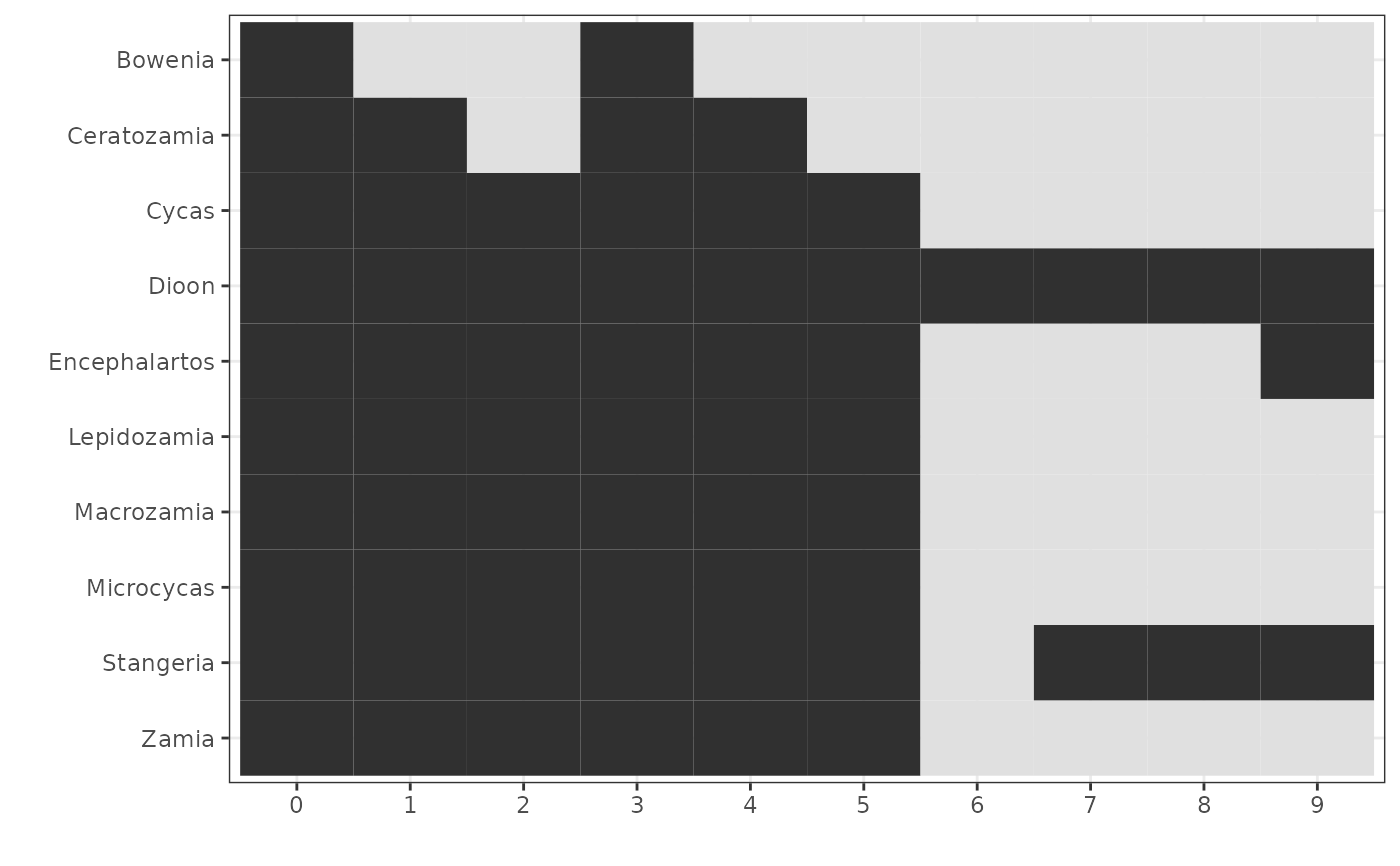
 # get genus-level taxonomic names
genus_txids <- get_txids(cycads, txids = cycads@txids, rnk = 'genus')
genus_txids <- unique(genus_txids)
# dropping missing
genus_txids <- genus_txids[genus_txids != '']
genus_nms <- get_tx_slot(cycads, genus_txids, slt_nm = 'scnm')
# make alphabetical for plotting
genus_nms <- sort(genus_nms, decreasing = TRUE)
# generate geom_object
p <- plot_phylota_pa(phylota = cycads, cids = cycads@cids, txids = genus_txids,
txnms = genus_nms)
# plot
print(p) # easier to interpret
# get genus-level taxonomic names
genus_txids <- get_txids(cycads, txids = cycads@txids, rnk = 'genus')
genus_txids <- unique(genus_txids)
# dropping missing
genus_txids <- genus_txids[genus_txids != '']
genus_nms <- get_tx_slot(cycads, genus_txids, slt_nm = 'scnm')
# make alphabetical for plotting
genus_nms <- sort(genus_nms, decreasing = TRUE)
# generate geom_object
p <- plot_phylota_pa(phylota = cycads, cids = cycads@cids, txids = genus_txids,
txnms = genus_nms)
# plot
print(p) # easier to interpret