Treemaps show relative size with boxes. The user can explore which taxa or clusters are most represented either by sequence or cluster number. If cluster IDs are provided, the plot is made for clusters. If taxonomic IDs are provided, the plot is made for taxa.
Details
The function can take a long time to run for large Phylota objects over many taxonomic IDs because searches are made across lineages. The idea of the function is to assess the data dominance of specific clusters and taxa.
See also
Other tools-public:
calc_mad(),
calc_wrdfrq(),
drop_by_rank(),
drop_clstrs(),
drop_sqs(),
get_clstr_slot(),
get_nsqs(),
get_ntaxa(),
get_sq_slot(),
get_stage_times(),
get_tx_slot(),
get_txids(),
is_txid_in_clstr(),
is_txid_in_sq(),
list_clstrrec_slots(),
list_ncbi_ranks(),
list_seqrec_slots(),
list_taxrec_slots(),
plot_phylota_pa(),
read_phylota(),
write_sqs()
Examples
data("tinamous")
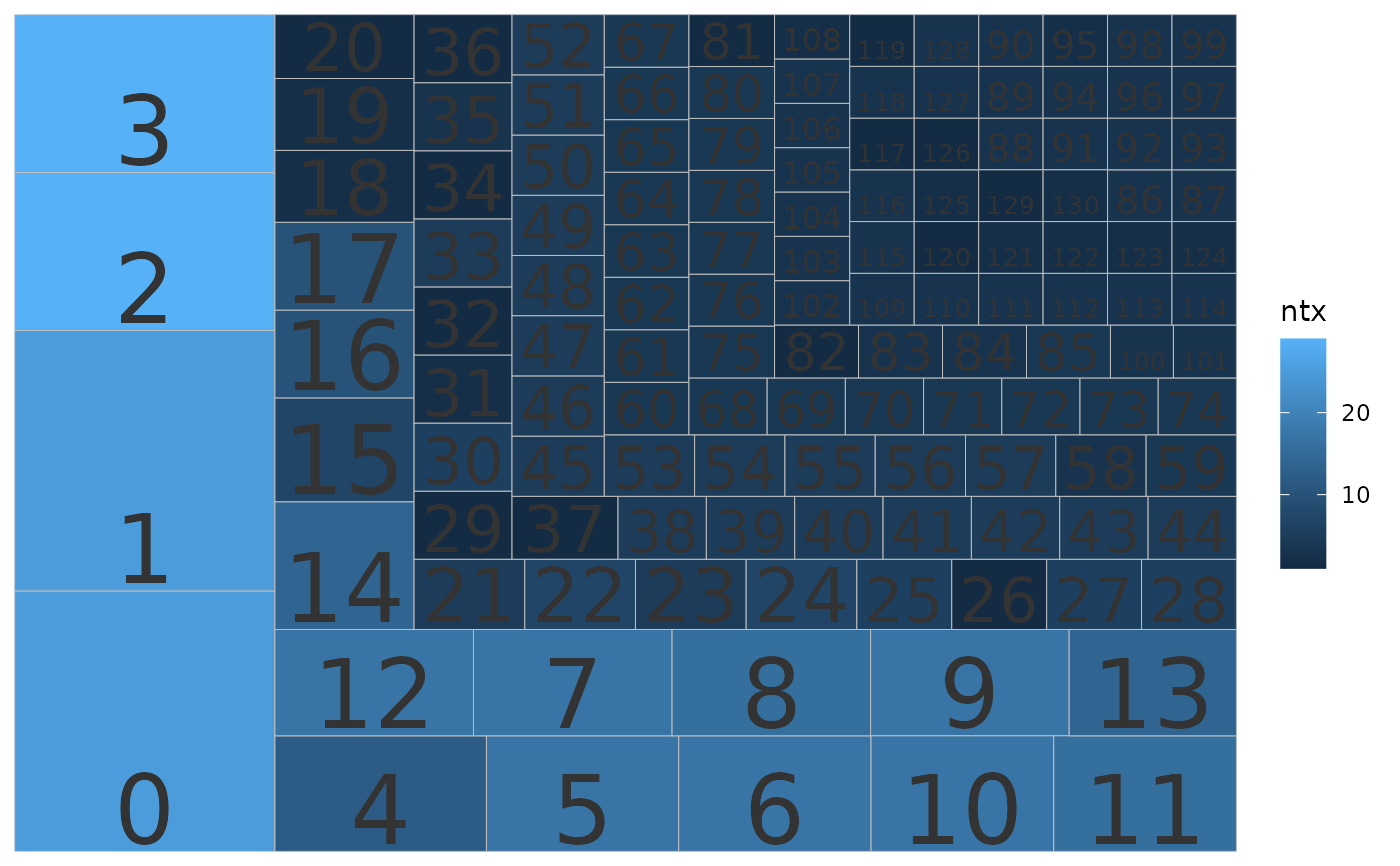
# Plot clusters, size by n. sq, fill by n. tx
p <- plot_phylota_treemap(phylota = tinamous, cids = tinamous@cids,
area = 'nsq', fill = 'ntx')
#> Warning: `aes_string()` was deprecated in ggplot2 3.0.0.
#> ℹ Please use tidy evaluation idioms with `aes()`.
#> ℹ See also `vignette("ggplot2-in-packages")` for more information.
#> ℹ The deprecated feature was likely used in the phylotaR package.
#> Please report the issue at <https://github.com/ropensci/phylotaR/issues>.
print(p)
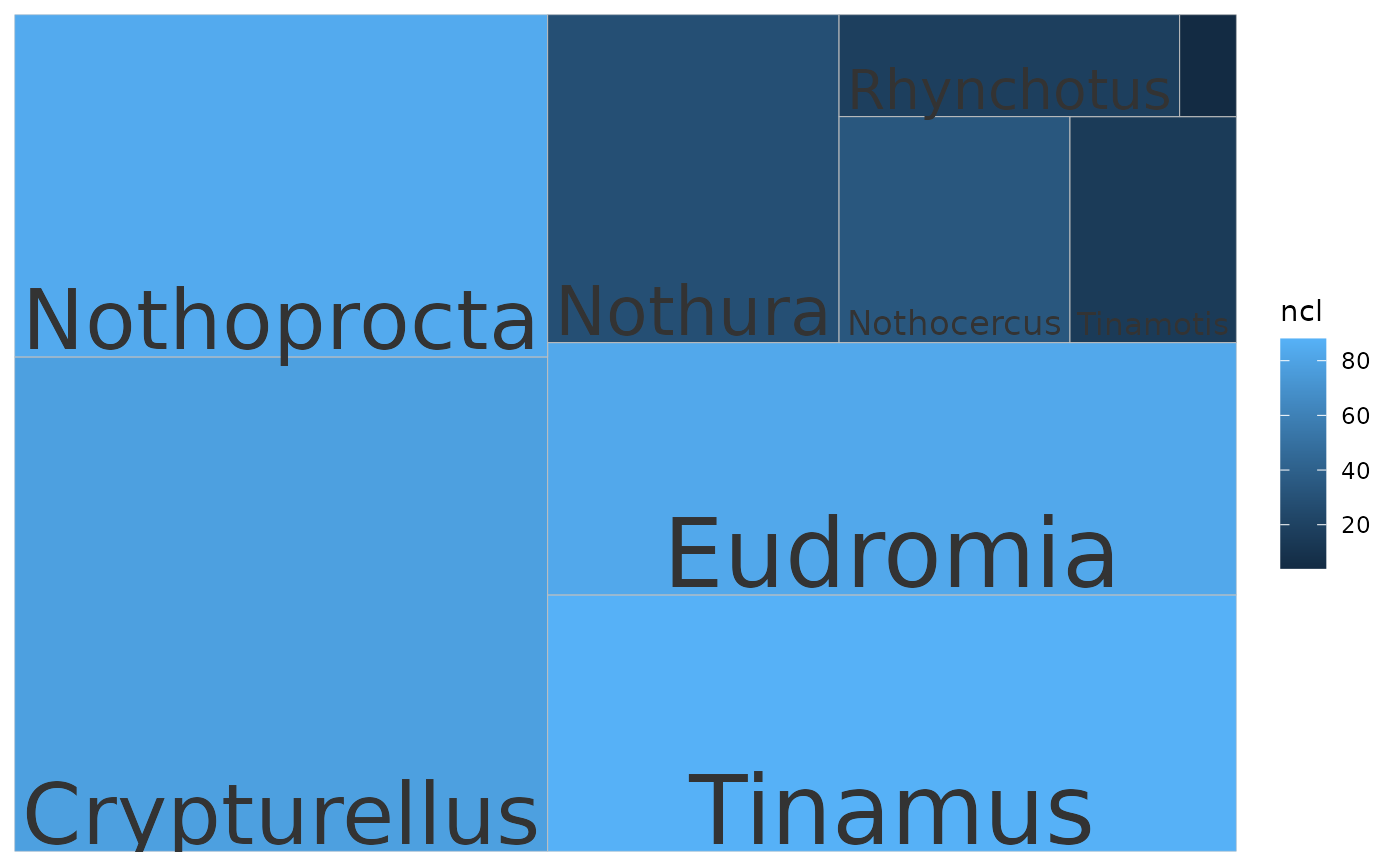
 # Plot taxa, size by n. sq, fill by ncl
txids <- get_txids(tinamous, txids = tinamous@txids, rnk = 'genus')
txids <- txids[txids != '']
txids <- unique(txids)
txnms <- get_tx_slot(tinamous, txids, slt_nm = 'scnm')
p <- plot_phylota_treemap(phylota = tinamous, txids = txids, txnms = txnms,
area = 'nsq', fill = 'ncl')
print(p)
# Plot taxa, size by n. sq, fill by ncl
txids <- get_txids(tinamous, txids = tinamous@txids, rnk = 'genus')
txids <- txids[txids != '']
txids <- unique(txids)
txnms <- get_tx_slot(tinamous, txids, slt_nm = 'scnm')
p <- plot_phylota_treemap(phylota = tinamous, txids = txids, txnms = txnms,
area = 'nsq', fill = 'ncl')
print(p)