This function calculates a simple rolling mean in base R. It is useful for calculating route characteristics such as mean distances of segments and changes in gradient.
Examples
r1 <- od_data_routes[od_data_routes$route_number == 2, ]
y <- r1$elevations
route_rolling_diff(y, lag = 1)
#> [1] 1.526316 4.500000 22.500000 12.625000 13.375000 2.857143 1.587302
#> [8] NA
route_rolling_diff(y, lag = 2)
#> [1] 6.026316 27.000000 9.875000 26.000000 10.517857 4.444444 NA
#> [8] NA
r1$elevations_diff_1 <- route_rolling_diff(y, lag = 1)
r1$elevations_diff_n <- route_rolling_diff(y, lag = 1, abs = FALSE)
d <- cumsum(r1$distances) - r1$distances / 2
diff_above_mean <- r1$elevations_diff_1 + mean(y)
diff_above_mean_n <- r1$elevations_diff_n + mean(y)
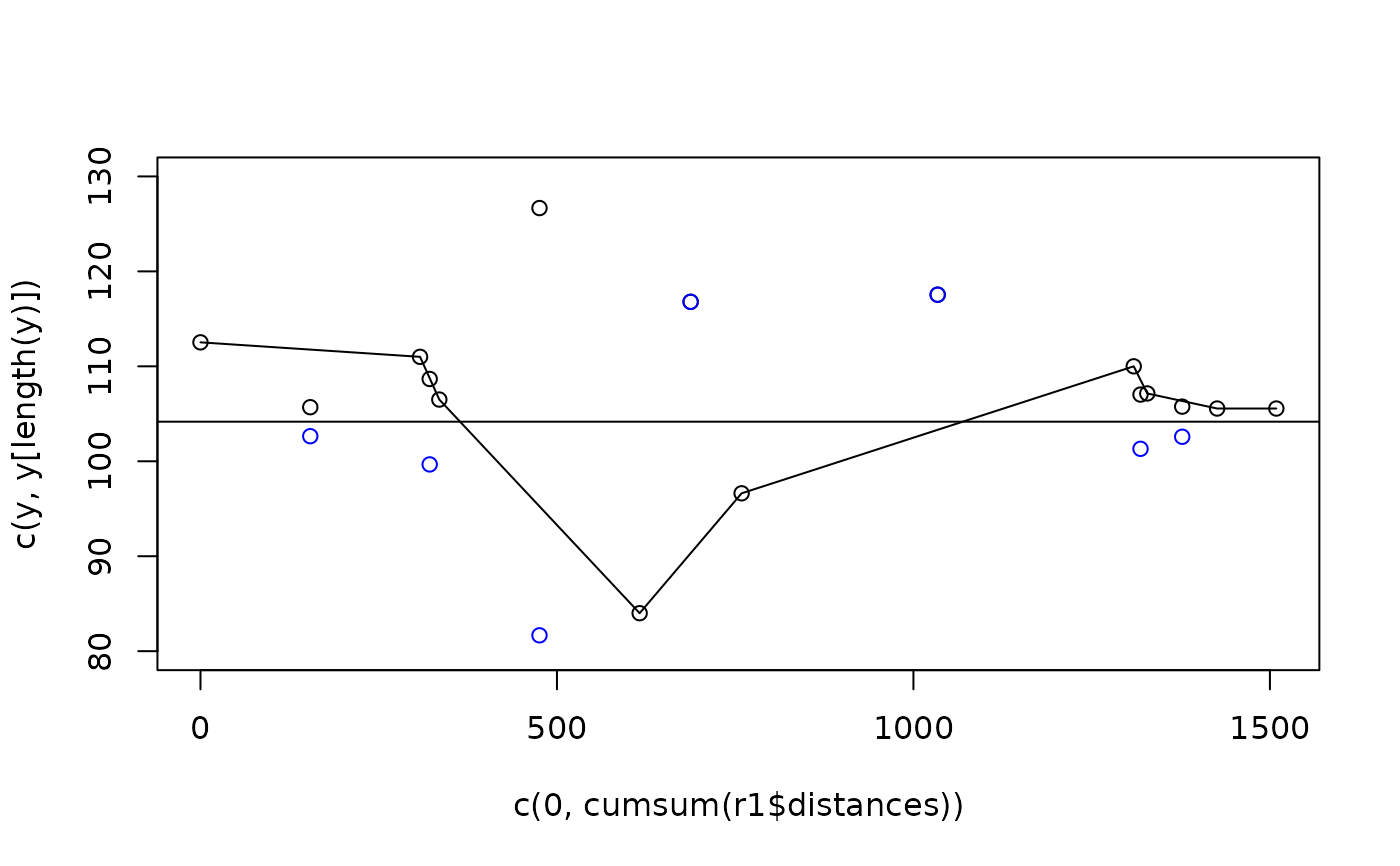
plot(c(0, cumsum(r1$distances)), c(y, y[length(y)]), ylim = c(80, 130))
lines(c(0, cumsum(r1$distances)), c(y, y[length(y)]))
points(d, diff_above_mean)
points(d, diff_above_mean_n, col = "blue")
abline(h = mean(y))