Calculate the gradient of line segments from a matrix of coordinates
Source:R/slope.R
route_slope_matrix.RdCalculate the gradient of line segments from a matrix of coordinates
Examples
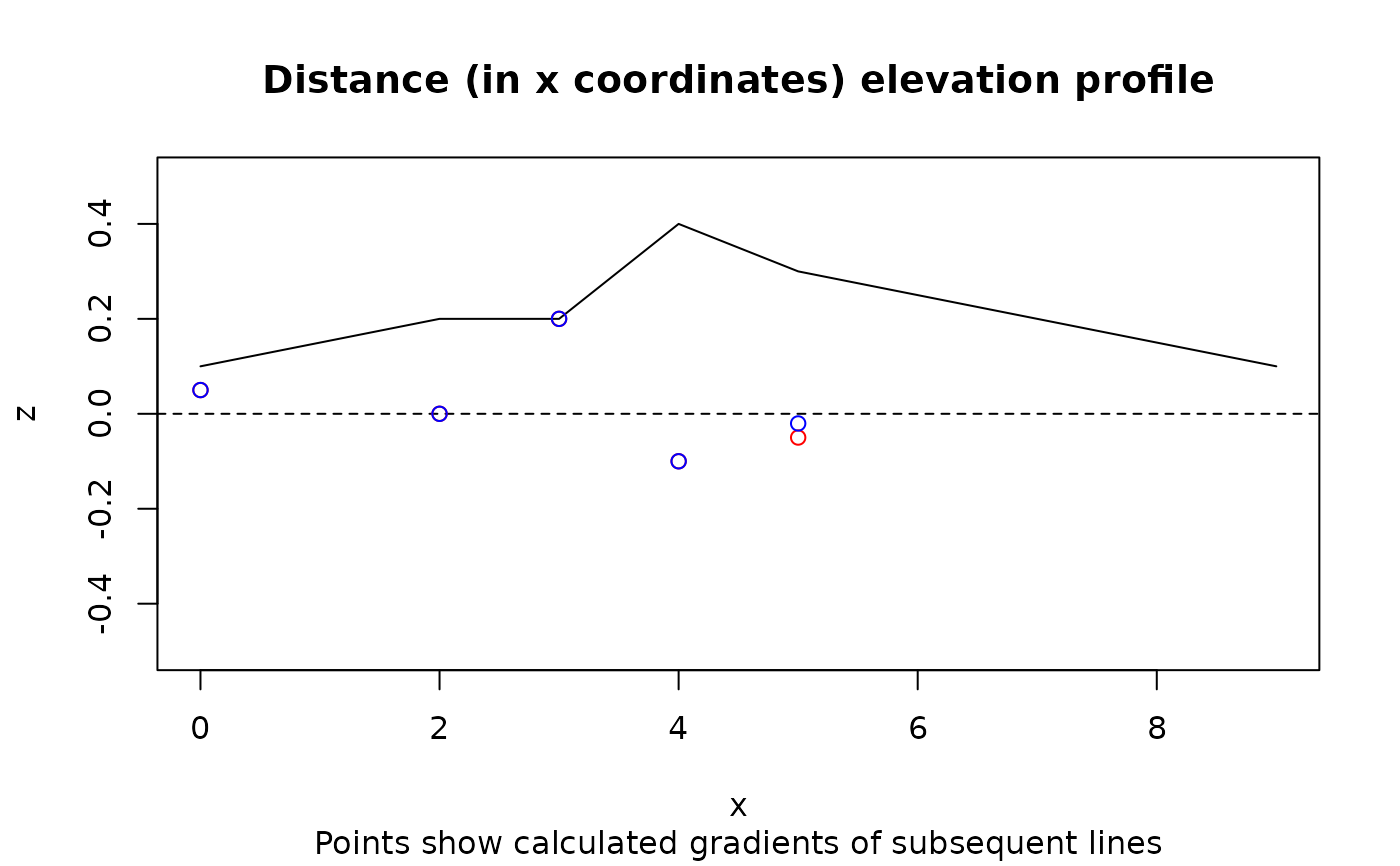
x <- c(0, 2, 3, 4, 5, 9)
y <- c(0, 0, 0, 0, 0, 9)
z <- c(1, 2, 2, 4, 3, 1) / 10
m <- cbind(x, y, z)
plot(x, z, ylim = c(-0.5, 0.5), type = "l")
(gx <- route_slope_vector(x, z))
#> [1]  0.05  0.00  0.20 -0.10 -0.05
(gxy <- route_slope_matrix(m, lonlat = FALSE))
#> [1]  0.05000000  0.00000000  0.20000000 -0.10000000 -0.02030692
abline(h = 0, lty = 2)
points(x[-length(x)], gx, col = "red")
points(x[-length(x)], gxy, col = "blue")
title("Distance (in x coordinates) elevation profile",
  sub = "Points show calculated gradients of subsequent lines"
)