Calculate rolling average gradient from elevation data at segment level
Source:R/route_funs.R
route_rolling_gradient.RdCalculate rolling average gradient from elevation data at segment level
Arguments
- elevations
Elevations, e.g. those provided by the
cyclestreetspackage- distances
Distances, e.g. those provided by the
cyclestreetspackage- lag
The window size of the smoothing function. The default, 3, will take the mean of values before, after and including each value.
- n
The window size of the smoothing function. The default, 3, will take the mean of values before, after and including each value.
- abs
Should the absolute (always positive) change be returned? True by default
Examples
r1 <- od_data_routes[od_data_routes$route_number == 2, ]
y <- r1$elevations
distances <- r1$distances
route_rolling_gradient(y, distances)
#> [1] 0.009112333 0.029220779 0.106132075 0.036435786 0.047012302 0.048840049
#> [7] 0.017539244 NA
route_rolling_gradient(y, distances, abs = FALSE)
#> [1] -0.009112333 -0.029220779 -0.106132075 0.036435786 0.047012302
#> [6] -0.048840049 -0.017539244 NA
route_rolling_gradient(y, distances, n = 3)
#> [1] NA 0.02191558 0.14966741 0.03888604 0.05635534 0.01285072 0.02380952
#> [8] NA
route_rolling_gradient(y, distances, n = 4)
#> [1] NA 0.02371542 0.08991009 0.05085599 0.06604938 0.01523810 NA
#> [8] NA
r1$elevations_diff_1 <- route_rolling_diff(y, lag = 1)
r1$rolling_gradient <- route_rolling_gradient(y, distances, n = 2)
r1$rolling_gradient3 <- route_rolling_gradient(y, distances, n = 3)
r1$rolling_gradient4 <- route_rolling_gradient(y, distances, n = 4)
d <- cumsum(r1$distances) - r1$distances / 2
diff_above_mean <- r1$elevations_diff_1 + mean(y)
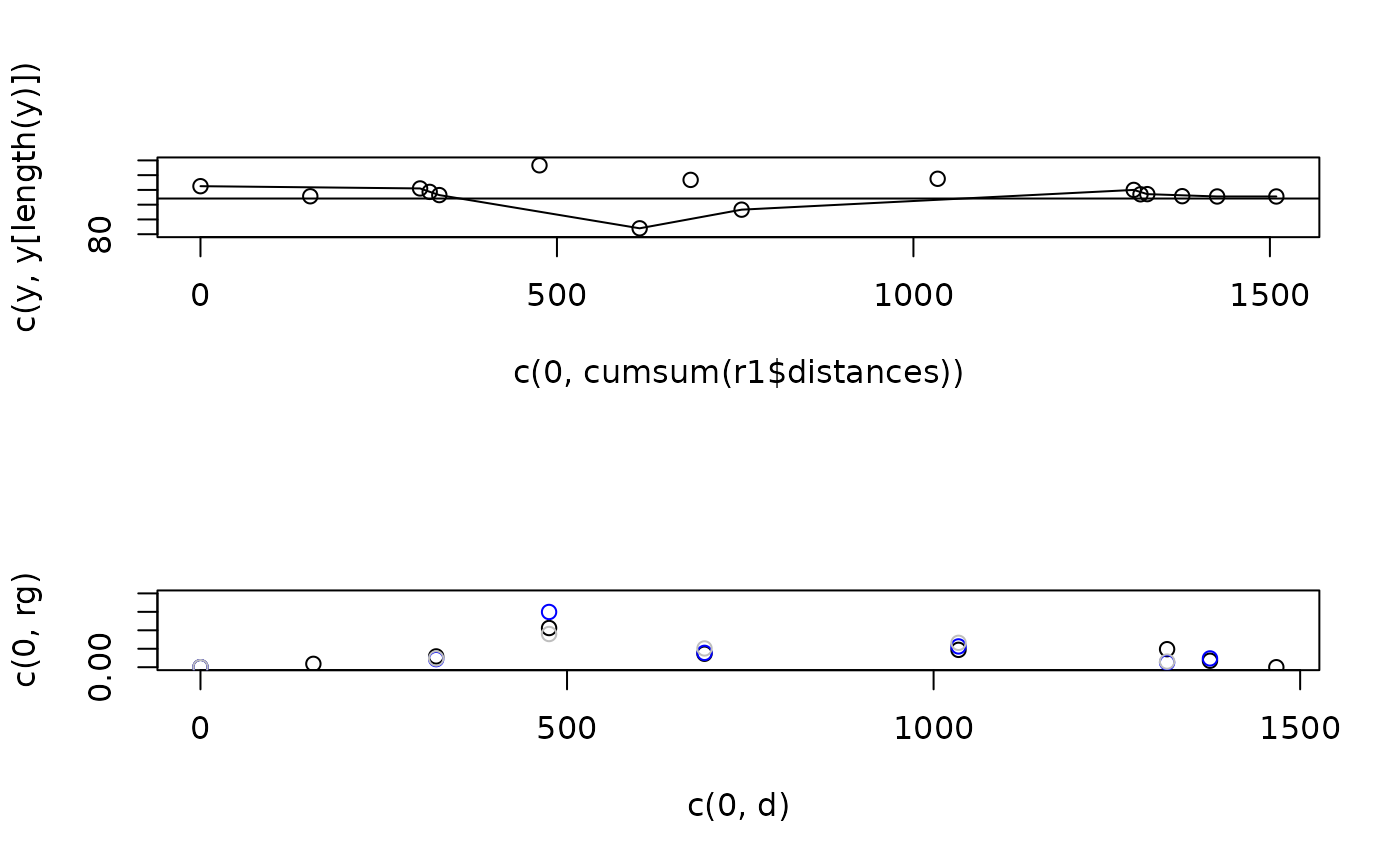
par(mfrow = c(2, 1))
plot(c(0, cumsum(r1$distances)), c(y, y[length(y)]), ylim = c(80, 130))
lines(c(0, cumsum(r1$distances)), c(y, y[length(y)]))
points(d, diff_above_mean)
abline(h = mean(y))
rg <- r1$rolling_gradient
rg[is.na(rg)] <- 0
plot(c(0, d), c(0, rg), ylim = c(0, 0.2))
points(c(0, d), c(0, r1$rolling_gradient3), col = "blue")
points(c(0, d), c(0, r1$rolling_gradient4), col = "grey")
 par(mfrow = c(1, 1))