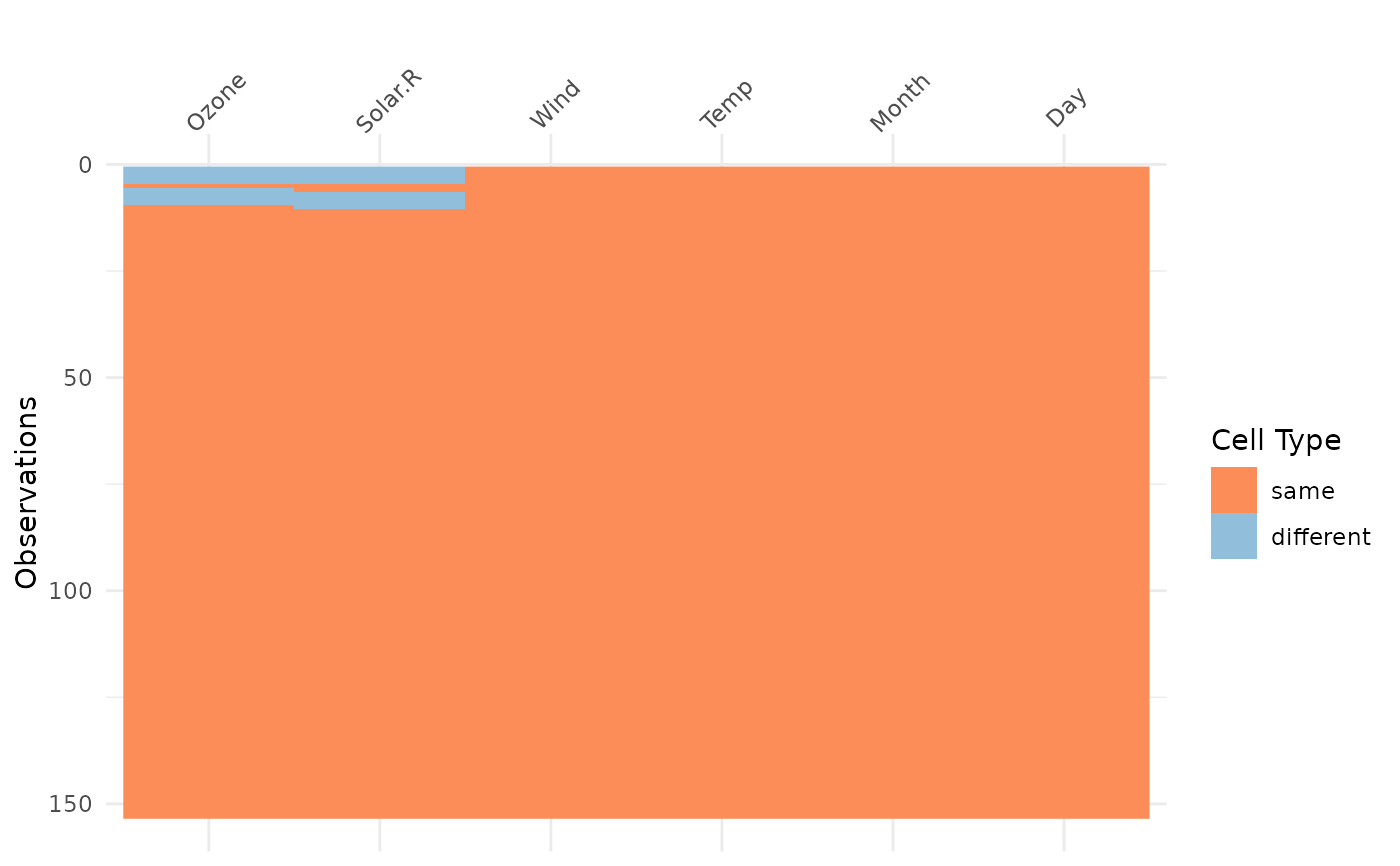
Visually compare two dataframes and see where they are different.
Source:R/vis-compare.R
vis_compare.Rdvis_compare, like the other vis_* families, gives an at-a-glance ggplot
of a dataset, but in this case, hones in on visualising two different
dataframes of the same dimension, so it takes two dataframes as arguments.
Value
ggplot2 object displaying which values in each data frame are
present in each other, and which are not.
