vis_expect visualises certain conditions or values in your data. For
example, If you are not sure whether to expect -1 in your data, you could
write: vis_expect(data, ~.x == -1), and you can see if there are times
where the values in your data are equal to -1. You could also, for example,
explore a set of bad strings, or possible NA values and visualise where
they are using vis_expect(data, ~.x %in% bad_strings) where
bad_strings is a character vector containing bad strings like N A
N/A etc.
Arguments
- data
a data.frame
- expectation
a formula following the syntax:
~.x {condition}. For example, writing~.x < 20would mean "where a variable value is less than 20, replace with NA", and~.x %in% {vector}would mean "where a variable has values that are in that vector".- show_perc
logical. TRUE now adds in the \ TRUE or FALSE in the whole dataset into the legend. Default value is TRUE.
Examples
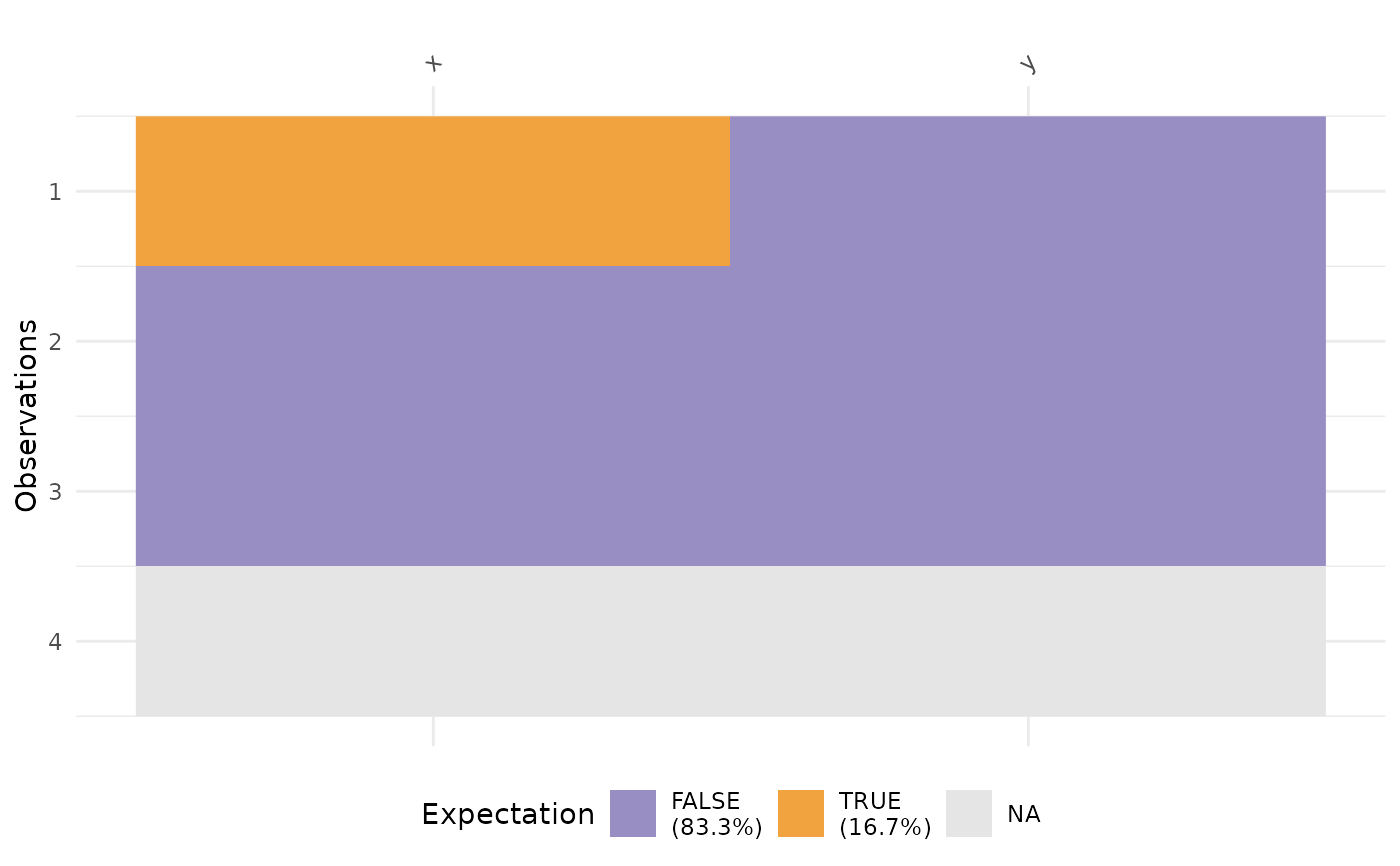
dat_test <- tibble::tribble(
            ~x, ~y,
            -1,  "A",
            0,  "B",
            1,  "C",
            NA, NA
            )

vis_expect(dat_test, ~.x == -1)


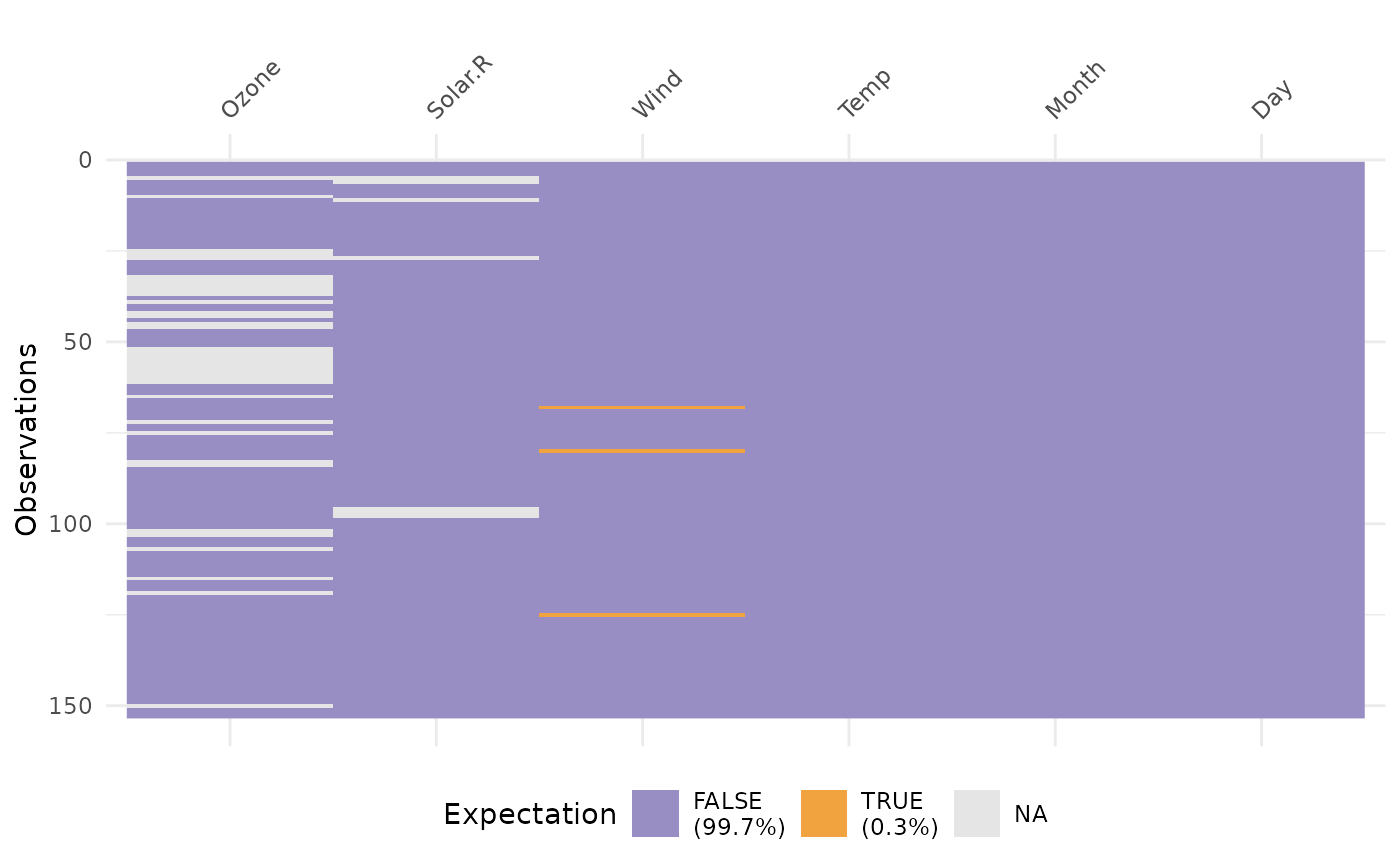
vis_expect(airquality, ~.x == 5.1)


# explore some common NA strings

common_nas <- c(
"NA",
"N A",
"N/A",
"na",
"n a",
"n/a"
)

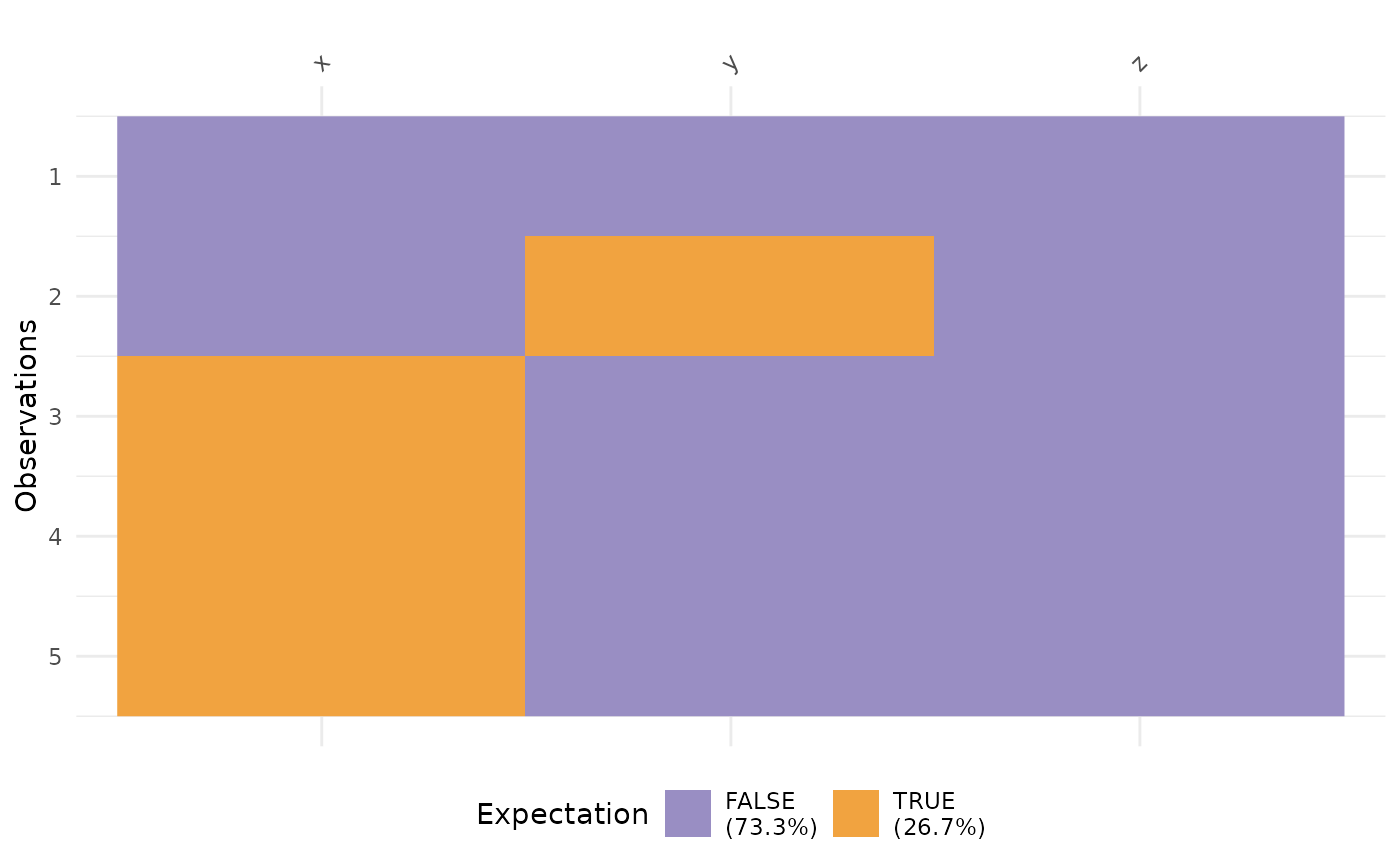
dat_ms <- tibble::tribble(~x,  ~y,    ~z,
                         "1",   "A",   -100,
                         "3",   "N/A", -99,
                         "NA",  NA,    -98,
                         "N A", "E",   -101,
                         "na", "F",   -1)

vis_expect(dat_ms, ~.x %in% common_nas)

