Stations
weathercan includes the function stations()
which returns a list of stations and their details (including
station_id).
## # A tibble: 6 × 17
##   prov  station_name        station_id climate_id WMO_id TC_id   lat   lon  elev tz        interval start   end normals normals_1991_2020 normals_1981_2010
##   <chr> <chr>                    <dbl> <chr>       <dbl> <chr> <dbl> <dbl> <dbl> <chr>     <fct>    <dbl> <dbl> <lgl>   <lgl>             <lgl>
## 1 AB    DAYSLAND                  1795 301AR54        NA <NA>   52.9 -112.  689. Etc/GMT+7 hour        NA    NA FALSE   FALSE             FALSE
## 2 AB    DAYSLAND                  1795 301AR54        NA <NA>   52.9 -112.  689. Etc/GMT+7 day       1908  1922 FALSE   FALSE             FALSE
## 3 AB    DAYSLAND                  1795 301AR54        NA <NA>   52.9 -112.  689. Etc/GMT+7 month     1908  1922 FALSE   FALSE             FALSE
## 4 AB    EDMONTON CORONATION       1796 301BK03        NA <NA>   53.6 -114.  671. Etc/GMT+7 hour        NA    NA FALSE   FALSE             FALSE
## 5 AB    EDMONTON CORONATION       1796 301BK03        NA <NA>   53.6 -114.  671. Etc/GMT+7 day       1978  1979 FALSE   FALSE             FALSE
## 6 AB    EDMONTON CORONATION       1796 301BK03        NA <NA>   53.6 -114.  671. Etc/GMT+7 month     1978  1979 FALSE   FALSE             FALSE
## # ℹ 1 more variable: normals_1971_2000 <lgl>## Rows: 26,448
## Columns: 17
## $ prov <chr> "AB", "AB", "AB", "AB", "AB", "AB", "AB", "AB", "AB", "AB", "AB", "AB", "AB", "AB", "AB", "AB", "AB", "AB", "AB", "AB", "AB", "AB", …
## $ station_name <chr> "DAYSLAND", "DAYSLAND", "DAYSLAND", "EDMONTON CORONATION", "EDMONTON CORONATION", "EDMONTON CORONATION", "FLEET", "FLEET", "FLEET", …
## $ station_id <dbl> 1795, 1795, 1795, 1796, 1796, 1796, 1797, 1797, 1797, 1798, 1798, 1798, 1799, 1799, 1799, 1800, 1800, 1800, 1801, 1801, 1801, 1802, …
## $ climate_id <chr> "301AR54", "301AR54", "301AR54", "301BK03", "301BK03", "301BK03", "301B6L0", "301B6L0", "301B6L0", "301B8LR", "301B8LR", "301B8LR", …
## $ WMO_id <dbl> NA, NA, NA, NA, NA, NA, NA, NA, NA, NA, NA, NA, NA, NA, NA, NA, NA, NA, NA, NA, NA, NA, NA, NA, NA, NA, NA, NA, NA, NA, NA, NA, NA, …
## $ TC_id <chr> NA, NA, NA, NA, NA, NA, NA, NA, NA, NA, NA, NA, NA, NA, NA, NA, NA, NA, NA, NA, NA, NA, NA, NA, NA, NA, NA, NA, NA, NA, NA, NA, NA, …
## $ lat <dbl> 52.87, 52.87, 52.87, 53.57, 53.57, 53.57, 52.15, 52.15, 52.15, 53.20, 53.20, 53.20, 52.40, 52.40, 52.40, 54.08, 54.08, 54.08, 53.52,…
## $ lon <dbl> -112.28, -112.28, -112.28, -113.57, -113.57, -113.57, -111.73, -111.73, -111.73, -110.15, -110.15, -110.15, -115.20, -115.20, -115.2…
## $ elev <dbl> 688.8, 688.8, 688.8, 670.6, 670.6, 670.6, 838.2, 838.2, 838.2, 640.0, 640.0, 640.0, 1036.0, 1036.0, 1036.0, 585.2, 585.2, 585.2, 668…
## $ tz <chr> "Etc/GMT+7", "Etc/GMT+7", "Etc/GMT+7", "Etc/GMT+7", "Etc/GMT+7", "Etc/GMT+7", "Etc/GMT+7", "Etc/GMT+7", "Etc/GMT+7", "Etc/GMT+7", "E…
## $ interval <fct> hour, day, month, hour, day, month, hour, day, month, hour, day, month, hour, day, month, hour, day, month, hour, day, month, hour, …
## $ start <dbl> NA, 1908, 1908, NA, 1978, 1978, NA, 1987, 1987, NA, 1987, 1987, NA, 1980, 1980, NA, 1980, 1980, NA, 1986, 1986, NA, 1987, 1987, NA, …
## $ end <dbl> NA, 1922, 1922, NA, 1979, 1979, NA, 1990, 1990, NA, 1998, 1998, NA, 2009, 2007, NA, 1981, 1981, NA, 2019, 2007, NA, 1991, 1991, NA, …
## $ normals <lgl> FALSE, FALSE, FALSE, FALSE, FALSE, FALSE, FALSE, FALSE, FALSE, FALSE, FALSE, FALSE, TRUE, TRUE, TRUE, FALSE, FALSE, FALSE, TRUE, TRU…
## $ normals_1991_2020 <lgl> FALSE, FALSE, FALSE, FALSE, FALSE, FALSE, FALSE, FALSE, FALSE, FALSE, FALSE, FALSE, FALSE, FALSE, FALSE, FALSE, FALSE, FALSE, FALSE,…
## $ normals_1981_2010 <lgl> FALSE, FALSE, FALSE, FALSE, FALSE, FALSE, FALSE, FALSE, FALSE, FALSE, FALSE, FALSE, TRUE, TRUE, TRUE, FALSE, FALSE, FALSE, TRUE, TRU…
## $ normals_1971_2000 <lgl> FALSE, FALSE, FALSE, FALSE, FALSE, FALSE, FALSE, FALSE, FALSE, FALSE, FALSE, FALSE, FALSE, FALSE, FALSE, FALSE, FALSE, FALSE, FALSE,…You can look through this data frame directly, or you can use the
stations_search function:
stations_search("Kamloops")## # A tibble: 40 × 17
## prov station_name station_id climate_id WMO_id TC_id lat lon elev tz interval start end normals normals_1991_2020 normals_1981_2010
## <chr> <chr> <dbl> <chr> <dbl> <chr> <dbl> <dbl> <dbl> <chr> <fct> <dbl> <dbl> <lgl> <lgl> <lgl>
## 1 BC KAMLOOPS 1274 1163779 NA <NA> 50.7 -120. 379. Etc/GMT+8 day 1878 1982 FALSE FALSE FALSE
## 2 BC KAMLOOPS 1274 1163779 NA <NA> 50.7 -120. 379. Etc/GMT+8 month 1878 1982 FALSE FALSE FALSE
## 3 BC KAMLOOPS A 1275 1163780 71887 YKA 50.7 -120. 345. Etc/GMT+8 hour 1953 2013 TRUE TRUE TRUE
## 4 BC KAMLOOPS A 1275 1163780 71887 YKA 50.7 -120. 345. Etc/GMT+8 day 1951 2013 TRUE TRUE TRUE
## 5 BC KAMLOOPS A 1275 1163780 71887 YKA 50.7 -120. 345. Etc/GMT+8 month 1951 2013 TRUE TRUE TRUE
## 6 BC KAMLOOPS A 51423 1163781 71887 YKA 50.7 -120. 345. Etc/GMT+8 hour 2013 2026 TRUE TRUE FALSE
## 7 BC KAMLOOPS A 51423 1163781 71887 YKA 50.7 -120. 345. Etc/GMT+8 day 2013 2026 TRUE TRUE FALSE
## 8 BC KAMLOOPS AFTON MINES 1276 1163790 NA <NA> 50.7 -120. 701 Etc/GMT+8 day 1977 1993 TRUE FALSE FALSE
## 9 BC KAMLOOPS AFTON MINES 1276 1163790 NA <NA> 50.7 -120. 701 Etc/GMT+8 month 1977 1993 TRUE FALSE FALSE
## 10 BC KAMLOOPS AUT 42203 1163842 71741 ZKA 50.7 -120. 345 Etc/GMT+8 hour 2006 2026 TRUE TRUE FALSE
## # ℹ 30 more rows
## # ℹ 1 more variable: normals_1971_2000 <lgl>You can narrow down your search by specifying time intervals (options are “hour”, “day”, or “month”):
stations_search("Kamloops", interval = "hour")## # A tibble: 3 × 17
## prov station_name station_id climate_id WMO_id TC_id lat lon elev tz interval start end normals normals_1991_2020 normals_1981_2010
## <chr> <chr> <dbl> <chr> <dbl> <chr> <dbl> <dbl> <dbl> <chr> <fct> <dbl> <dbl> <lgl> <lgl> <lgl>
## 1 BC KAMLOOPS A 1275 1163780 71887 YKA 50.7 -120. 345. Etc/GMT+8 hour 1953 2013 TRUE TRUE TRUE
## 2 BC KAMLOOPS A 51423 1163781 71887 YKA 50.7 -120. 345. Etc/GMT+8 hour 2013 2026 TRUE TRUE FALSE
## 3 BC KAMLOOPS AUT 42203 1163842 71741 ZKA 50.7 -120. 345 Etc/GMT+8 hour 2006 2026 TRUE TRUE FALSE
## # ℹ 1 more variable: normals_1971_2000 <lgl>You can specify more than one interval:
stations_search("Kamloops", interval = c("hour", "month"))## # A tibble: 21 × 17
## prov station_name station_id climate_id WMO_id TC_id lat lon elev tz interval start end normals normals_1991_2020 normals_1981_2010
## <chr> <chr> <dbl> <chr> <dbl> <chr> <dbl> <dbl> <dbl> <chr> <fct> <dbl> <dbl> <lgl> <lgl> <lgl>
## 1 BC KAMLOOPS 1274 1163779 NA <NA> 50.7 -120. 379. Etc/GMT+8 month 1878 1982 FALSE FALSE FALSE
## 2 BC KAMLOOPS A 1275 1163780 71887 YKA 50.7 -120. 345. Etc/GMT+8 hour 1953 2013 TRUE TRUE TRUE
## 3 BC KAMLOOPS A 1275 1163780 71887 YKA 50.7 -120. 345. Etc/GMT+8 month 1951 2013 TRUE TRUE TRUE
## 4 BC KAMLOOPS A 51423 1163781 71887 YKA 50.7 -120. 345. Etc/GMT+8 hour 2013 2026 TRUE TRUE FALSE
## 5 BC KAMLOOPS AFTON MINES 1276 1163790 NA <NA> 50.7 -120. 701 Etc/GMT+8 month 1977 1993 TRUE FALSE FALSE
## 6 BC KAMLOOPS AUT 42203 1163842 71741 ZKA 50.7 -120. 345 Etc/GMT+8 hour 2006 2026 TRUE TRUE FALSE
## 7 BC KAMLOOPS AUT 42203 1163842 71741 ZKA 50.7 -120. 345 Etc/GMT+8 month 2006 2006 TRUE TRUE FALSE
## 8 BC KAMLOOPS CDA 1277 1163810 NA <NA> 50.7 -120. 345 Etc/GMT+8 month 1949 1977 FALSE FALSE FALSE
## 9 BC KAMLOOPS CHERRY CREEK 1278 1163814 NA <NA> 50.7 -121. 556. Etc/GMT+8 month 1970 1974 FALSE FALSE FALSE
## 10 BC KAMLOOPS CHERRY CREEK 2 1279 1163815 NA <NA> 50.6 -121. 701 Etc/GMT+8 month 1974 1977 FALSE FALSE FALSE
## # ℹ 11 more rows
## # ℹ 1 more variable: normals_1971_2000 <lgl>You can also search by proximity. These results include a new column
distance specifying the distance in km from the
coordinates:
stations_search(
  coords = c(50.667492, -120.329049),
  dist = 20,
  interval = "hour"
)
## # A tibble: 3 × 18
## prov station_name station_id climate_id WMO_id TC_id lat lon elev tz interval start end normals normals_1991_2020 normals_1981_2010
## <chr> <chr> <dbl> <chr> <dbl> <chr> <dbl> <dbl> <dbl> <chr> <fct> <dbl> <dbl> <lgl> <lgl> <lgl>
## 1 BC KAMLOOPS A 1275 1163780 71887 YKA 50.7 -120. 345. Etc/GMT+8 hour 1953 2013 TRUE TRUE TRUE
## 2 BC KAMLOOPS AUT 42203 1163842 71741 ZKA 50.7 -120. 345 Etc/GMT+8 hour 2006 2026 TRUE TRUE FALSE
## 3 BC KAMLOOPS A 51423 1163781 71887 YKA 50.7 -120. 345. Etc/GMT+8 hour 2013 2026 TRUE TRUE FALSE
## # ℹ 2 more variables: normals_1971_2000 <lgl>, distance <dbl>We can also perform more complex searches using filter()
function from the dplyr package direction on the data
returned by stations():
BCstations <- stations() |>
  filter(prov %in% c("BC")) |>
  filter(interval == "hour") |>
  filter(lat > 49 & lat < 49.5) |>
  filter(lon > -119 & lon < -116) |>
  filter(start <= 2002) |>
  filter(end >= 2016)
BCstations
## # A tibble: 3 × 17
## prov station_name station_id climate_id WMO_id TC_id lat lon elev tz interval start end normals normals_1991_2020 normals_1981_2010
## <chr> <chr> <dbl> <chr> <dbl> <chr> <dbl> <dbl> <dbl> <chr> <fct> <dbl> <dbl> <lgl> <lgl> <lgl>
## 1 BC CRESTON CAMPBELL SCIENTIFIC 6838 114B1F0 71770 WJR 49.1 -116. 641. Etc/G… hour 1994 2026 TRUE TRUE FALSE
## 2 BC NELSON CS 6839 1145M29 71776 WNM 49.5 -117. 535. Etc/G… hour 1994 2026 TRUE TRUE FALSE
## 3 BC WARFIELD RCS 31067 1148705 71401 XWF 49.1 -118. 567. Etc/G… hour 2001 2026 TRUE TRUE FALSE
## # ℹ 1 more variable: normals_1971_2000 <lgl>
## weather_dl() accepts numbers so we can create a vector to input into weather:
stn_vector <- BCstations$station_id
stn_vector
## [1] 6838 6839 31067You can update this list of stations with
And check when it was last updated with
## # A tibble: 1 × 2
##   ECCC_modified       weathercan_modified
##   <dttm>              <date>
## 1 2026-06-03 23:30:00 2026-06-16
Weather
Once you have your station_id(s) you can download
weather data:
kam <- weather_dl(station_ids = 51423, start = "2016-01-01", end = "2016-02-15")## As of weathercan v0.3.0 time display is either local time or UTC See Details under
## is shown once per session
kam## # A tibble: 1,104 × 38
## station_name station_id station_operator prov lat lon elev climate_id WMO_id TC_id date time year month day hour qual temp
## <chr> <dbl> <lgl> <chr> <dbl> <dbl> <dbl> <chr> <chr> <chr> <date> <dttm> <dbl> <int> <int> <time> <chr> <dbl>
## 1 KAMLOOPS A 51423 NA BC 50.7 -120. 345. 1163781 71887 YKA 2016-01-01 2016-01-01 00:00:00 2016 1 1 00:00 <NA> -9.1
## 2 KAMLOOPS A 51423 NA BC 50.7 -120. 345. 1163781 71887 YKA 2016-01-01 2016-01-01 01:00:00 2016 1 1 01:00 <NA> -9.6
## 3 KAMLOOPS A 51423 NA BC 50.7 -120. 345. 1163781 71887 YKA 2016-01-01 2016-01-01 02:00:00 2016 1 1 02:00 <NA> -9.9
## 4 KAMLOOPS A 51423 NA BC 50.7 -120. 345. 1163781 71887 YKA 2016-01-01 2016-01-01 03:00:00 2016 1 1 03:00 <NA> -9.5
## 5 KAMLOOPS A 51423 NA BC 50.7 -120. 345. 1163781 71887 YKA 2016-01-01 2016-01-01 04:00:00 2016 1 1 04:00 <NA> -9.4
## 6 KAMLOOPS A 51423 NA BC 50.7 -120. 345. 1163781 71887 YKA 2016-01-01 2016-01-01 05:00:00 2016 1 1 05:00 <NA> -9.8
## 7 KAMLOOPS A 51423 NA BC 50.7 -120. 345. 1163781 71887 YKA 2016-01-01 2016-01-01 06:00:00 2016 1 1 06:00 <NA> -10
## 8 KAMLOOPS A 51423 NA BC 50.7 -120. 345. 1163781 71887 YKA 2016-01-01 2016-01-01 07:00:00 2016 1 1 07:00 <NA> -10.2
## 9 KAMLOOPS A 51423 NA BC 50.7 -120. 345. 1163781 71887 YKA 2016-01-01 2016-01-01 08:00:00 2016 1 1 08:00 <NA> -10.1
## 10 KAMLOOPS A 51423 NA BC 50.7 -120. 345. 1163781 71887 YKA 2016-01-01 2016-01-01 09:00:00 2016 1 1 09:00 <NA> -9.7
## # ℹ 1,094 more rows
## # ℹ 20 more variables: temp_flag <chr>, temp_dew <dbl>, temp_dew_flag <chr>, rel_hum <dbl>, rel_hum_flag <chr>, precip_amt <dbl>, precip_amt_flag <chr>,
## # wind_dir <dbl>, wind_dir_flag <chr>, wind_spd <dbl>, wind_spd_flag <chr>, visib <dbl>, visib_flag <chr>, pressure <dbl>, pressure_flag <chr>, hmdx <dbl>,
## # hmdx_flag <chr>, wind_chill <dbl>, wind_chill_flag <chr>, weather <chr>You can also download data from multiple stations at once:
kam.pg <- weather_dl(
  station_ids = c(48248, 51423),
  start = "2016-01-01",
  end = "2016-02-15"
)

kam.pg
## # A tibble: 2,208 × 38
## station_name station_id station_operator prov lat lon elev climate_id WMO_id TC_id date time year month day hour qual temp
## <chr> <dbl> <lgl> <chr> <dbl> <dbl> <dbl> <chr> <chr> <chr> <date> <dttm> <dbl> <int> <int> <tim> <chr> <dbl>
## 1 PRINCE GEORGE… 48248 NA BC 53.9 -123. 680 1096453 71302 VXS 2016-01-01 2016-01-01 00:00:00 2016 1 1 00:00 <NA> -21.2
## 2 PRINCE GEORGE… 48248 NA BC 53.9 -123. 680 1096453 71302 VXS 2016-01-01 2016-01-01 01:00:00 2016 1 1 01:00 <NA> -21.4
## 3 PRINCE GEORGE… 48248 NA BC 53.9 -123. 680 1096453 71302 VXS 2016-01-01 2016-01-01 02:00:00 2016 1 1 02:00 <NA> -22.8
## 4 PRINCE GEORGE… 48248 NA BC 53.9 -123. 680 1096453 71302 VXS 2016-01-01 2016-01-01 03:00:00 2016 1 1 03:00 <NA> -23.1
## 5 PRINCE GEORGE… 48248 NA BC 53.9 -123. 680 1096453 71302 VXS 2016-01-01 2016-01-01 04:00:00 2016 1 1 04:00 <NA> -22.9
## 6 PRINCE GEORGE… 48248 NA BC 53.9 -123. 680 1096453 71302 VXS 2016-01-01 2016-01-01 05:00:00 2016 1 1 05:00 <NA> -24.2
## 7 PRINCE GEORGE… 48248 NA BC 53.9 -123. 680 1096453 71302 VXS 2016-01-01 2016-01-01 06:00:00 2016 1 1 06:00 <NA> -21.8
## 8 PRINCE GEORGE… 48248 NA BC 53.9 -123. 680 1096453 71302 VXS 2016-01-01 2016-01-01 07:00:00 2016 1 1 07:00 <NA> -22.7
## 9 PRINCE GEORGE… 48248 NA BC 53.9 -123. 680 1096453 71302 VXS 2016-01-01 2016-01-01 08:00:00 2016 1 1 08:00 <NA> -22.7
## 10 PRINCE GEORGE… 48248 NA BC 53.9 -123. 680 1096453 71302 VXS 2016-01-01 2016-01-01 09:00:00 2016 1 1 09:00 <NA> -22.9
## # ℹ 2,198 more rows
## # ℹ 20 more variables: temp_flag <chr>, temp_dew <dbl>, temp_dew_flag <chr>, rel_hum <dbl>, rel_hum_flag <chr>, precip_amt <dbl>, precip_amt_flag <chr>,
## # wind_dir <dbl>, wind_dir_flag <chr>, wind_spd <dbl>, wind_spd_flag <chr>, visib <dbl>, visib_flag <chr>, pressure <dbl>, pressure_flag <chr>, hmdx <dbl>,
## # hmdx_flag <chr>, wind_chill <dbl>, wind_chill_flag <chr>, weather <chr>And plot it:
ggplot(
  data = kam.pg,
  aes(x = time, y = temp, group = station_name, colour = station_name)
) +
  theme(legend.position = "top") +
  geom_line() +
  theme_minimal()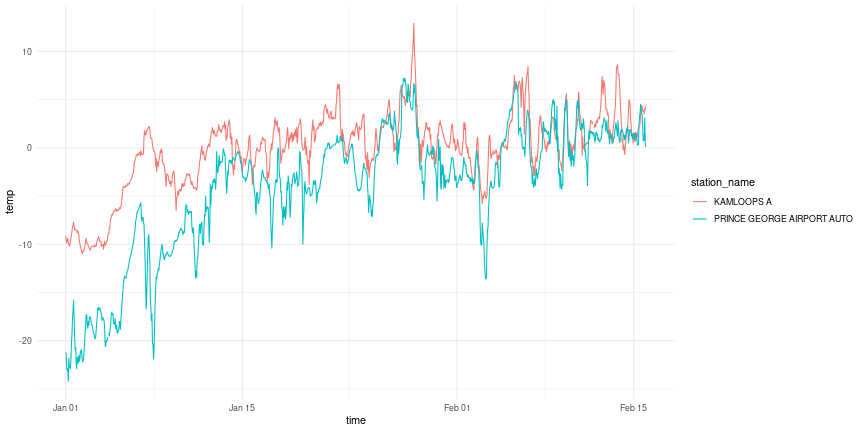
plot of chunk unnamed-chunk-12
Or you can use the vector created above:
stn_vec_df <- weather_dl(
  station_ids = stn_vector,
  start = "2016-01-01",
  end = "2016-02-15"
)

stn_vec_df
## # A tibble: 3,312 × 38
## station_name station_id station_operator prov lat lon elev climate_id WMO_id TC_id date time year month day hour qual temp
## <chr> <dbl> <lgl> <chr> <dbl> <dbl> <dbl> <chr> <chr> <chr> <date> <dttm> <dbl> <int> <int> <tim> <chr> <dbl>
## 1 CRESTON CAMPB… 6838 NA BC 49.1 -116. 641. 114B1F0 71770 WJR 2016-01-01 2016-01-01 00:00:00 2016 1 1 00:00 <NA> -7.2
## 2 CRESTON CAMPB… 6838 NA BC 49.1 -116. 641. 114B1F0 71770 WJR 2016-01-01 2016-01-01 01:00:00 2016 1 1 01:00 <NA> -7.8
## 3 CRESTON CAMPB… 6838 NA BC 49.1 -116. 641. 114B1F0 71770 WJR 2016-01-01 2016-01-01 02:00:00 2016 1 1 02:00 <NA> -8
## 4 CRESTON CAMPB… 6838 NA BC 49.1 -116. 641. 114B1F0 71770 WJR 2016-01-01 2016-01-01 03:00:00 2016 1 1 03:00 <NA> -8.1
## 5 CRESTON CAMPB… 6838 NA BC 49.1 -116. 641. 114B1F0 71770 WJR 2016-01-01 2016-01-01 04:00:00 2016 1 1 04:00 <NA> -8.4
## 6 CRESTON CAMPB… 6838 NA BC 49.1 -116. 641. 114B1F0 71770 WJR 2016-01-01 2016-01-01 05:00:00 2016 1 1 05:00 <NA> -8.5
## 7 CRESTON CAMPB… 6838 NA BC 49.1 -116. 641. 114B1F0 71770 WJR 2016-01-01 2016-01-01 06:00:00 2016 1 1 06:00 <NA> -8.9
## 8 CRESTON CAMPB… 6838 NA BC 49.1 -116. 641. 114B1F0 71770 WJR 2016-01-01 2016-01-01 07:00:00 2016 1 1 07:00 <NA> -9.1
## 9 CRESTON CAMPB… 6838 NA BC 49.1 -116. 641. 114B1F0 71770 WJR 2016-01-01 2016-01-01 08:00:00 2016 1 1 08:00 <NA> -9.2
## 10 CRESTON CAMPB… 6838 NA BC 49.1 -116. 641. 114B1F0 71770 WJR 2016-01-01 2016-01-01 09:00:00 2016 1 1 09:00 <NA> -9.5
## # ℹ 3,302 more rows
## # ℹ 20 more variables: temp_flag <chr>, temp_dew <dbl>, temp_dew_flag <chr>, rel_hum <dbl>, rel_hum_flag <chr>, precip_amt <dbl>, precip_amt_flag <chr>,
## # wind_dir <dbl>, wind_dir_flag <chr>, wind_spd <dbl>, wind_spd_flag <chr>, visib <dbl>, visib_flag <chr>, pressure <dbl>, pressure_flag <chr>, hmdx <dbl>,
## # hmdx_flag <chr>, wind_chill <dbl>, wind_chill_flag <chr>, weather <lgl>For more information on the data flags, see the Flags vignette, for more information on units and terms, see the Terms and Units vignette.
Climate Normals
To access climate normals, you first need to know the
climate_id associated with the station you’re interested
in.
stations_search("Winnipeg", normals_years = "current")## The most current normals available for download by weathercan are '1991-2020'## # A tibble: 10 × 17
## prov station_name station_id climate_id WMO_id TC_id lat lon elev tz interval start end normals normals_1991_2020 normals_1981_2010
## <chr> <chr> <dbl> <chr> <dbl> <chr> <dbl> <dbl> <dbl> <chr> <fct> <dbl> <dbl> <lgl> <lgl> <lgl>
## 1 MB WINNIPEG A CS 27174 502S001 71849 XWG 49.9 -97.2 239. Etc/… hour 2013 2026 TRUE TRUE FALSE
## 2 MB WINNIPEG A CS 27174 502S001 71849 XWG 49.9 -97.2 239. Etc/… day 1996 2026 TRUE TRUE FALSE
## 3 MB WINNIPEG A CS 27174 502S001 71849 XWG 49.9 -97.2 239. Etc/… month 1996 2007 TRUE TRUE FALSE
## 4 MB WINNIPEG INTL A 51097 5023227 NA YWG 49.9 -97.2 239. Etc/… hour 2013 2026 TRUE TRUE FALSE
## 5 MB WINNIPEG INTL A 51097 5023227 NA YWG 49.9 -97.2 239. Etc/… day 2018 2026 TRUE TRUE FALSE
## 6 MB WINNIPEG RICHARDSON AWOS 47407 5023226 71852 YWG 49.9 -97.2 239. Etc/… hour 2008 2013 TRUE TRUE FALSE
## 7 MB WINNIPEG RICHARDSON AWOS 47407 5023226 71852 YWG 49.9 -97.2 239. Etc/… day 2008 2013 TRUE TRUE FALSE
## 8 MB WINNIPEG RICHARDSON INT'L A 3698 5023222 71852 YWG 49.9 -97.2 239. Etc/… hour 1953 2013 TRUE TRUE TRUE
## 9 MB WINNIPEG RICHARDSON INT'L A 3698 5023222 71852 YWG 49.9 -97.2 239. Etc/… day 1938 2008 TRUE TRUE TRUE
## 10 MB WINNIPEG RICHARDSON INT'L A 3698 5023222 71852 YWG 49.9 -97.2 239. Etc/… month 1938 2007 TRUE TRUE TRUE
## # ℹ 1 more variable: normals_1971_2000 <lgl>The current year range is 1991-2020, but you can also search for stations in the previous year range:
stations_search("Winnipeg", normals_years = "1981-2010")## # A tibble: 3 × 17
## prov station_name station_id climate_id WMO_id TC_id lat lon elev tz interval start end normals normals_1991_2020 normals_1981_2010
## <chr> <chr> <dbl> <chr> <dbl> <chr> <dbl> <dbl> <dbl> <chr> <fct> <dbl> <dbl> <lgl> <lgl> <lgl>
## 1 MB WINNIPEG RICHARDSON INT'L A 3698 5023222 71852 YWG 49.9 -97.2 239. Etc/G… hour 1953 2013 TRUE TRUE TRUE
## 2 MB WINNIPEG RICHARDSON INT'L A 3698 5023222 71852 YWG 49.9 -97.2 239. Etc/G… day 1938 2008 TRUE TRUE TRUE
## 3 MB WINNIPEG RICHARDSON INT'L A 3698 5023222 71852 YWG 49.9 -97.2 239. Etc/G… month 1938 2007 TRUE TRUE TRUE
## # ℹ 1 more variable: normals_1971_2000 <lgl>Note that the Winnipeg station has normals for both year ranges.
Then you can download the climate normals with the
normals_dl() function.
n <- normals_dl("5023222")## The most current normals available for download by weathercan are '1991-2020'
## Using composite locations: WINNIPEG RICHARDSON (AIRPORT)
n## # A tibble: 26 × 313
## location_name prov composite_stations period_of_record period daily_average_c daily_average_c_code stddev_mean_monthly_…¹ stddev_mean_monthly_…²
## <chr> <chr> <chr> <chr> <chr> <dbl> <chr> <dbl> <chr>
## 1 WINNIPEG RICHARDSON (AIR… MB WINNIPEG A CS (50… Normal Jan -16.3 A 3.6 A
## 2 WINNIPEG RICHARDSON (AIR… MB WINNIPEG A CS (50… Normal Feb -14.1 A 4 A
## 3 WINNIPEG RICHARDSON (AIR… MB WINNIPEG A CS (50… Normal Mar -6.1 A 3.7 A
## 4 WINNIPEG RICHARDSON (AIR… MB WINNIPEG A CS (50… Normal Apr 3.8 A 2.9 A
## 5 WINNIPEG RICHARDSON (AIR… MB WINNIPEG A CS (50… Normal May 11.1 A 1.9 A
## 6 WINNIPEG RICHARDSON (AIR… MB WINNIPEG A CS (50… Normal Jun 17.1 A 1.5 A
## 7 WINNIPEG RICHARDSON (AIR… MB WINNIPEG A CS (50… Normal Jul 19.5 A 1.4 A
## 8 WINNIPEG RICHARDSON (AIR… MB WINNIPEG A CS (50… Normal Aug 18.7 A 1.5 A
## 9 WINNIPEG RICHARDSON (AIR… MB WINNIPEG A CS (50… Normal Sep 13.3 A 1.6 A
## 10 WINNIPEG RICHARDSON (AIR… MB WINNIPEG A CS (50… Normal Oct 5.1 A 2.1 A
## # ℹ 16 more rows
## # ℹ abbreviated names: ¹stddev_mean_monthly_temperature_c, ²stddev_mean_monthly_temperature_c_code
## # ℹ 304 more variables: daily_maximum_c <dbl>, daily_maximum_c_code <chr>, daily_minimum_c <dbl>, daily_minimum_c_code <chr>, maximum_daily_mean_c <dbl>,
## # maximum_daily_mean_c_code <lgl>, maximum_daily_mean_c_date <date>, maximum_daily_mean_c_date_code <lgl>, minimum_daily_mean_c <dbl>,
## # minimum_daily_mean_c_code <lgl>, minimum_daily_mean_c_date <date>, minimum_daily_mean_c_date_code <lgl>, extreme_maximum_c <dbl>,
## # extreme_maximum_c_code <lgl>, extreme_maximum_c_date <date>, extreme_maximum_c_date_code <lgl>, minimum_daily_maximum_c <dbl>,
## # minimum_daily_maximum_c_code <lgl>, minimum_daily_maximum_c_date <date>, minimum_daily_maximum_c_date_code <lgl>, maximum_daily_minimum_c <dbl>, …Older normals can be downloaded by changing the year
n <- normals_dl("5023222", normals_year = "1981-2010")
n
## # A tibble: 1 × 7
## prov station_name climate_id normals_years meets_wmo normals frost
## <chr> <chr> <chr> <chr> <lgl> <list> <list>
## 1 MB WINNIPEG RICHARDSON INT'L A 5023222 1981-2010 TRUE <tibble [13 × 197]> <tibble [7 × 8]>Note that older normals have two parts to the data, average weather measurements and average frost dates.
## # A tibble: 13 × 203
##    prov  station_name                climate_id normals_years meets_wmo period temp_daily_average temp_daily_average_code temp_sd temp_sd_code temp_daily_max
##    <chr> <chr>                       <chr>      <chr>         <lgl>     <fct>               <dbl> <chr>                     <dbl> <chr>                 <dbl>
##  1 MB    WINNIPEG RICHARDSON INT'L A 5023222    1981-2010     TRUE      Jan                 -16.4 A                           4.1 A                     -11.3
##  2 MB    WINNIPEG RICHARDSON INT'L A 5023222    1981-2010     TRUE      Feb                 -13.2 A                           4.2 A                      -8.1
##  3 MB    WINNIPEG RICHARDSON INT'L A 5023222    1981-2010     TRUE      Mar                  -5.8 A                           3.1 A                      -0.8
##  4 MB    WINNIPEG RICHARDSON INT'L A 5023222    1981-2010     TRUE      Apr                   4.4 A                           2.7 A                      10.9
##  5 MB    WINNIPEG RICHARDSON INT'L A 5023222    1981-2010     TRUE      May                  11.6 A                           2.1 A                      18.6
##  6 MB    WINNIPEG RICHARDSON INT'L A 5023222    1981-2010     TRUE      Jun                  17   A                           2   A                      23.2
##  7 MB    WINNIPEG RICHARDSON INT'L A 5023222    1981-2010     TRUE      Jul                  19.7 A                           1.4 A                      25.9
##  8 MB    WINNIPEG RICHARDSON INT'L A 5023222    1981-2010     TRUE      Aug                  18.8 A                           1.9 A                      25.4
##  9 MB    WINNIPEG RICHARDSON INT'L A 5023222    1981-2010     TRUE      Sep                  12.7 A                           1.3 A                      19
## 10 MB    WINNIPEG RICHARDSON INT'L A 5023222    1981-2010     TRUE      Oct                   5   A                           1.8 A                      10.5
## 11 MB    WINNIPEG RICHARDSON INT'L A 5023222    1981-2010     TRUE      Nov                  -4.9 A                           3.6 A                      -0.5
## 12 MB    WINNIPEG RICHARDSON INT'L A 5023222    1981-2010     TRUE      Dec                 -13.2 A                           4.4 A                      -8.5
## 13 MB    WINNIPEG RICHARDSON INT'L A 5023222    1981-2010     TRUE      Year                  3   A                           1.2 A                       8.7
## # ℹ 192 more variables: temp_daily_max_code <chr>, temp_daily_min <dbl>, temp_daily_min_code <chr>, temp_extreme_max <dbl>, temp_extreme_max_code <chr>,
## #   temp_extreme_max_date <date>, temp_extreme_max_date_code <chr>, temp_extreme_min <dbl>, temp_extreme_min_code <chr>, temp_extreme_min_date <date>,
## #   temp_extreme_min_date_code <chr>, rain <dbl>, rain_code <chr>, snow <dbl>, snow_code <chr>, precip <dbl>, precip_code <chr>, snow_mean_depth <dbl>,
## #   snow_mean_depth_code <chr>, snow_median_depth <dbl>, snow_median_depth_code <chr>, snow_depth_month_end <dbl>, snow_depth_month_end_code <chr>,
## #   rain_extreme_daily <dbl>, rain_extreme_daily_code <chr>, rain_extreme_daily_date <date>, rain_extreme_daily_date_code <chr>, snow_extreme_daily <dbl>,
## #   snow_extreme_daily_code <chr>, snow_extreme_daily_date <date>, snow_extreme_daily_date_code <chr>, precip_extreme_daily <dbl>,
## #   precip_extreme_daily_code <chr>, precip_extreme_daily_date <date>, precip_extreme_daily_date_code <chr>, snow_extreme_depth <dbl>, …
unnest(n, frost)## # A tibble: 7 × 14
## prov station_name climate_id normals_years meets_wmo normals frost_code date_last_spring_frost date_first_fall_frost length_frost_free prob
## <chr> <chr> <chr> <chr> <lgl> <list> <chr> <dbl> <dbl> <dbl> <chr>
## 1 MB WINNIPEG RICHARDSON INT'L A 5023222 1981-2010 TRUE <tibble> A 143 265 121 10%
## 2 MB WINNIPEG RICHARDSON INT'L A 5023222 1981-2010 TRUE <tibble> A 143 265 121 25%
## 3 MB WINNIPEG RICHARDSON INT'L A 5023222 1981-2010 TRUE <tibble> A 143 265 121 33%
## 4 MB WINNIPEG RICHARDSON INT'L A 5023222 1981-2010 TRUE <tibble> A 143 265 121 50%
## 5 MB WINNIPEG RICHARDSON INT'L A 5023222 1981-2010 TRUE <tibble> A 143 265 121 66%
## 6 MB WINNIPEG RICHARDSON INT'L A 5023222 1981-2010 TRUE <tibble> A 143 265 121 75%
## 7 MB WINNIPEG RICHARDSON INT'L A 5023222 1981-2010 TRUE <tibble> A 143 265 121 90%
## # ℹ 3 more variables: prob_last_spring_temp_below_0_on_date <dbl>, prob_first_fall_temp_below_0_on_date <dbl>, prob_length_frost_free <dbl>