Takes an origin (A) and destination (B), represented by the linestring l,
and generates 3 extra geometries based on points p:
Details
From A to P1 (P1 being the nearest point to A)
From P1 to P2 (P2 being the nearest point to B)
From P2 to B
Examples
library(sf)
l <- flowlines_sf[2:4, ]
p <- destinations_sf
lv <- line_via(l, p)
lv
#> Simple feature collection with 3 features and 15 fields
#> Active geometry column: geometry
#> Geometry type: LINESTRING
#> Dimension: XY
#> Bounding box: xmin: -1.550807 ymin: 53.8158 xmax: -1.516734 ymax: 53.82887
#> Geodetic CRS: WGS 84
#> Area.of.residence Area.of.workplace All Work.mainly.at.or.from.home
#> 920578 E02002361 E02002367 10 0
#> 920582 E02002361 E02002371 44 0
#> 920587 E02002361 E02002377 34 0
#> Underground..metro..light.rail..tram Train Bus..minibus.or.coach Taxi
#> 920578 0 0 1 0
#> 920582 0 0 2 2
#> 920587 0 0 0 1
#> Motorcycle..scooter.or.moped Driving.a.car.or.van
#> 920578 0 8
#> 920582 0 28
#> 920587 2 19
#> Passenger.in.a.car.or.van Bicycle On.foot Other.method.of.travel.to.work
#> 920578 0 0 1 0
#> 920582 3 3 6 0
#> 920587 3 0 9 0
#> id geometry
#> 920578 E02002361 E02002367 LINESTRING (-1.516734 53.82...
#> 920582 E02002361 E02002371 LINESTRING (-1.516734 53.82...
#> 920587 E02002361 E02002377 LINESTRING (-1.516734 53.82...
#> leg_orig leg_via
#> 920578 LINESTRING (-1.516734 53.82... LINESTRING (-1.517333 53.82...
#> 920582 LINESTRING (-1.516734 53.82... LINESTRING (-1.517333 53.82...
#> 920587 LINESTRING (-1.516734 53.82... LINESTRING (-1.517333 53.82...
#> leg_dest
#> 920578 LINESTRING (-1.555112 53.82...
#> 920582 LINESTRING (-1.534205 53.81...
#> 920587 LINESTRING (-1.521311 53.81...
# library(mapview)
# mapview(lv) +
# mapview(lv$leg_orig, col = "red")
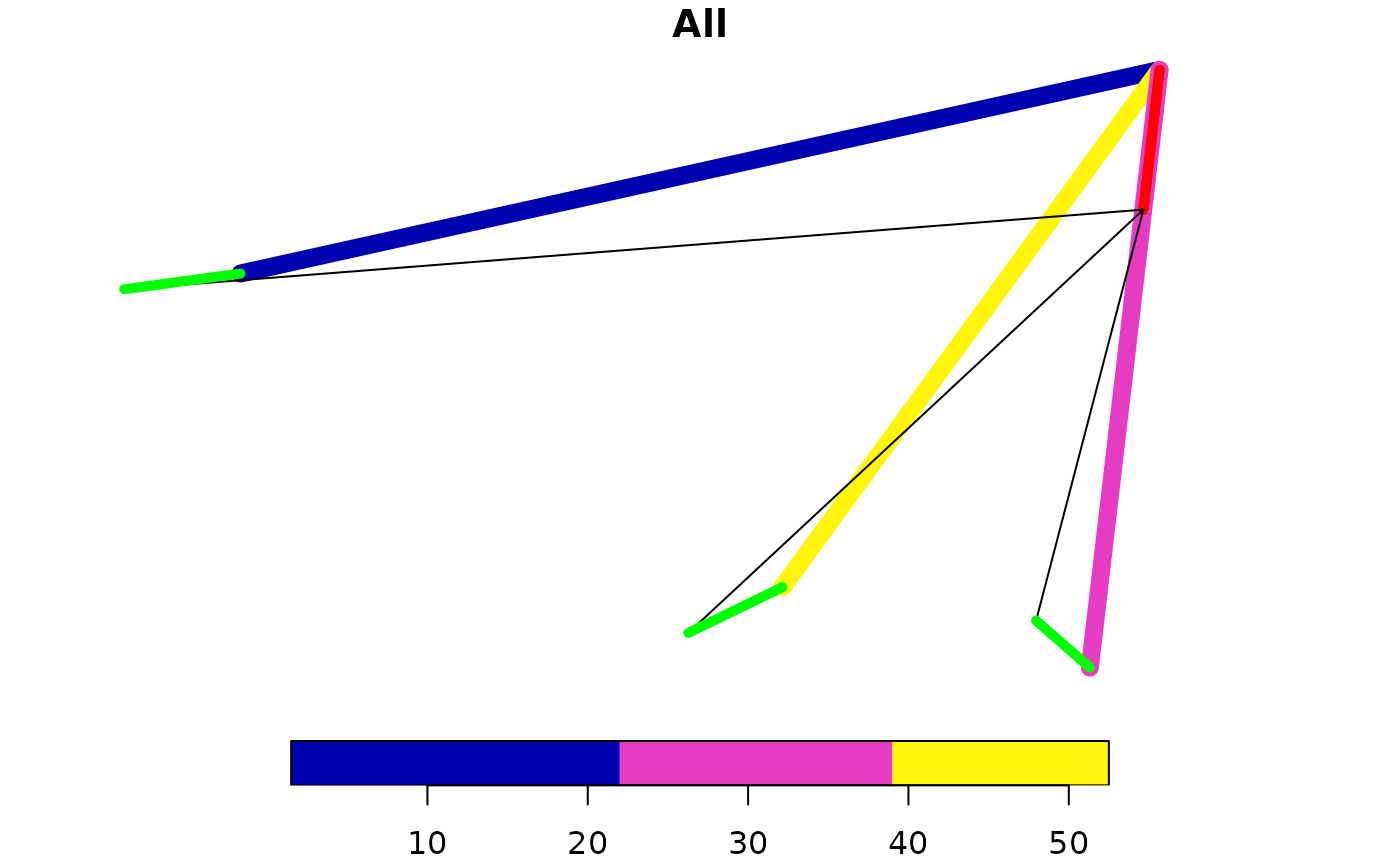
plot(lv[3], lwd = 9, reset = FALSE)
plot(lv$leg_orig, col = "red", lwd = 5, add = TRUE)
plot(lv$leg_via, col = "black", add = TRUE)
plot(lv$leg_dest, col = "green", lwd = 5, add = TRUE)