Takes a series of geographical points and converts them into a spatial (linestring) object representing the potential flows, or 'spatial interaction', between every combination of points.
Examples
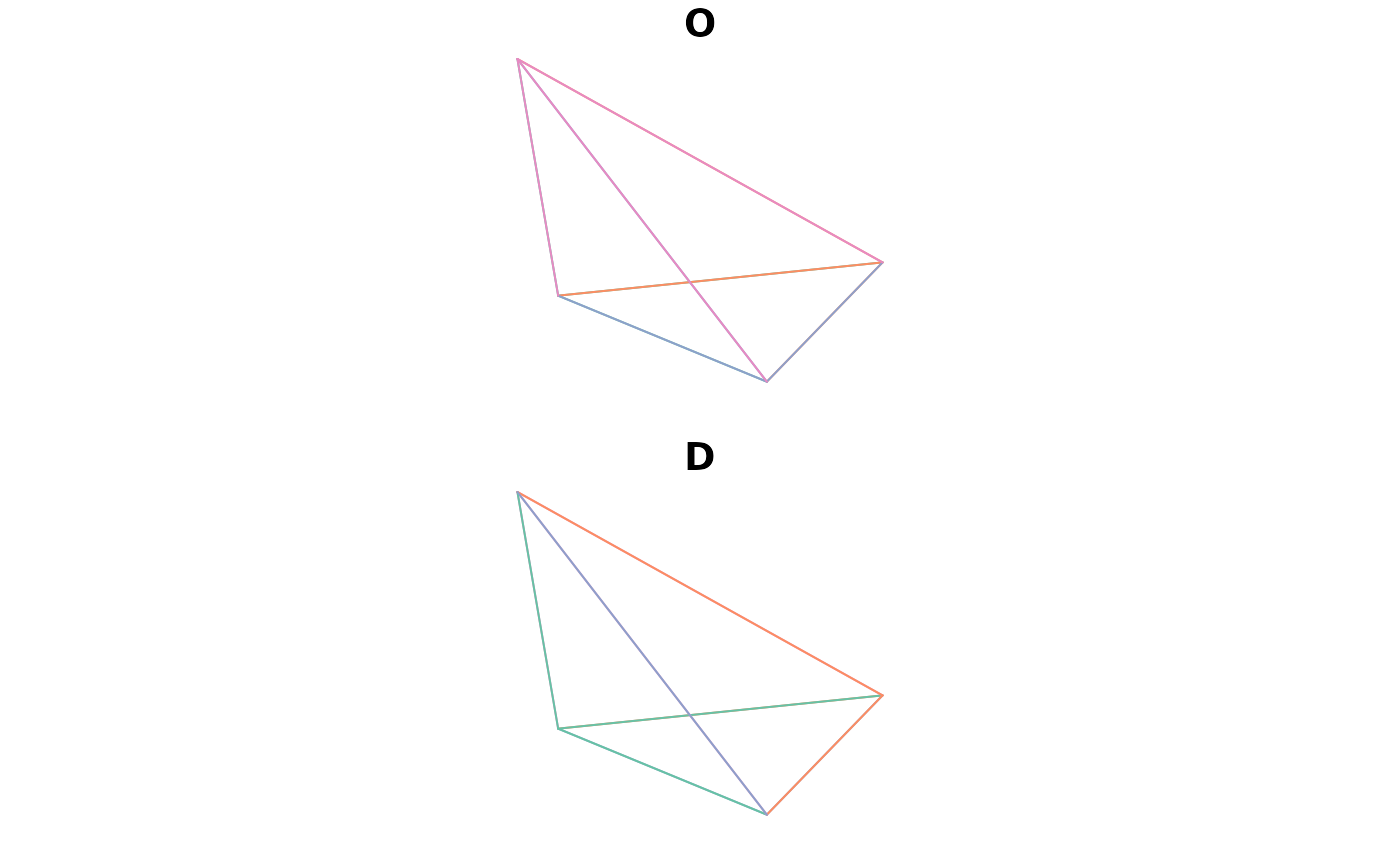
flow_sf <- points2flow(cents_sf[1:4, ])
plot(flow_sf)